
Media service from: 26.06.2024
The new Linz City Dashboard serves as a central platform that contains many important city data and facts. Economic indicators range from mobility data to environmental information. Citizens should gain transparent and easily accessible insight into their city’s data. It is not just about providing data, but adding value by presenting and categorizing this data in an understandable format. The City Dashboard can be accessed via city-dashboard.linz.at and the linz.at homepage.
“It’s a special moment when City Dashboard goes live. Henceforth, all citizens, organizations, institutions and other interested parties will receive permanent live data from a wide range of urban areas. This information is highly relevant to the city and provides useful insights into the economic situation, urban life, climate, environment and mobility. The City Dashboard is an important milestone for Linz as Austria’s digitization capital,” emphasizes Mayor Klaus Lüger.
“As the transport officer of the city of Linz, I support complete transparency in the mobility sector. Detectors on the Nibelungen and railway bridges provide us with real-time data displayed on a new dashboard. Among others, the modal split, i.e. the share of different modes of transport in total traffic volumes, is broken down in detail. By showing developments over time, we can see if we are progressing in the right direction,” says the moving officer, deputy mayor. Mac. Martin Hazard.
“The City Dashboard provides Linsers with insight into various aspects of city life. Especially in the area of climate and environment, the continuous supply of data enables a better overview of environmentally relevant information. In the next phase, the ongoing innovations in the Lins Air Information System will help to better publish data from this area via the dashboard. ” says the climate city councillor. Mac.A Eva Schopsberger.
“Our city dashboard gives you essential data about Linz. To make this possible, several technical challenges had to be overcome in advance. We took values from different areas of city administration and produced data sources using an attractive design so that they are understandable to the people of Linz at a glance. The platform now enables citizens to easily access comprehensive, up-to-date information about their city,” explains the Municipal Director. Mac.A Ulrich Hummer.
The city of Linz’s City Dashboard project pursues the ambitious goal of providing citizens with comprehensive insight into various aspects of urban life by providing real-time data and detailed analysis. A dashboard is primarily used to visualize data, thereby making the information easier to understand and use. The Linz City Dashboard includes information on the economic situation, urban life, climate, environment and mobility. The continuous provision of current data aims to expand citizens’ information options on various topics and at the same time increase the transparency and traceability of city processes.
A variety of specialized data sources are used to implement the City Dashboard. These mainly come from the city’s Planning, Technology and Environment Division and the Urban Research Department in the City Government Office Division. An important aspect is the timeliness of the data: while real-time data is aggregated directly via interfaces and updated continuously – daily or every minute – historical data is typically updated monthly or annually.
Specifically what data is involved?
For example, you can find out on a daily basis how many children are cared for in municipal facilities or which sports equipment is available for running in which playgrounds. In case of flooding, the current status of the Danube will be critical. Other topics the site provides data on include: district-wise key settlements and overnight stays in tourism to the number of people crossing the railway bridge by car, bicycle or foot, to detailed information on the use of e-scooters. The platform consists of three sub-dashboards with the main topics “City Life & Economy”, Climate & Environment” and “Mobility”.
Target groups of city dashboard
The City Dashboard is primarily aimed at the citizens of Linz, but also provides valuable insights and information for the public administration and local institutions. Data-savvy citizens particularly benefit from access to comprehensive and up-to-date information about various areas of life in Linz. It also promotes understanding of urban processes.
Technology implementation and integration
Implementation of this project was technically challenging, integration and preparation of diverse data sources required careful planning and execution to present data accurately and in a citizen-friendly manner. Additionally, it is essential to ensure consistent and attractive design of the site to maximize user experience. The dashboard also includes various interfaces to other city systems, such as the tree registry and the Children and Youth Services Management System, for example displaying real-time data on the number of children cared for in city facilities.
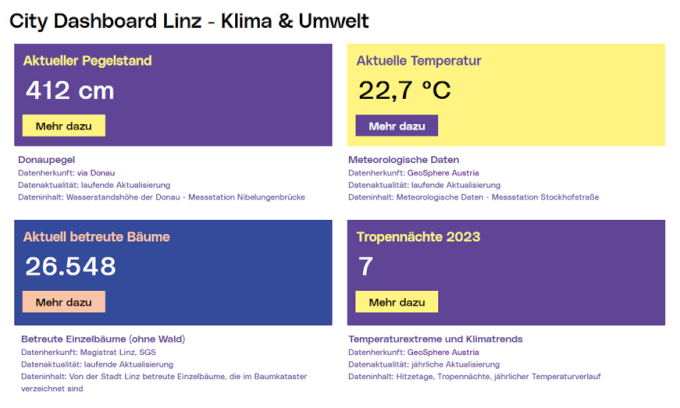 Example of data on “Climate and Environment”, Source: Urban Research
 Example of data on buildings, Source: Urban Research
The project is currently in its final stages. But the dashboard is continuously maintained and improved even after the completion of the project. New data sources, such as the Linz Air Information System, which is currently being updated, will be integrated in the future to further increase the dashboard’s information content and relevance.
The City Dashboard took about a year to develop and is based on M.App Enterprise government software from Hexagon/Intergraph. This software was specifically purchased as an extension of the existing Geographical Information System (GIS) of the City of Linz and is used to visualize real-time data.
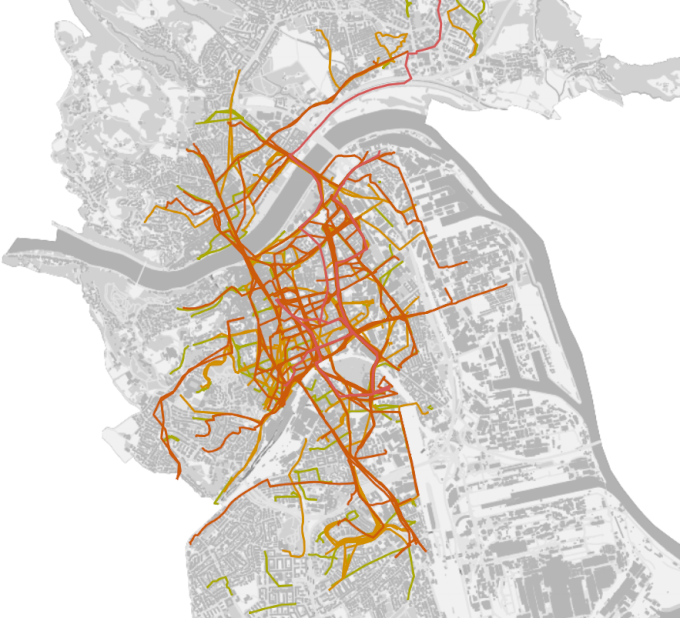
Analysis of traffic flows
Although there is currently no direct use of artificial intelligence (AI) in the Linz City Dashboard, data from intelligent detectors placed at strategic points in the city that analyze traffic is used. Depending on the type of information, data is displayed in the form of graphs, charts or interactive elements. It allows users to access and understand various data in an intuitive way.
The use of intelligent detectors to record traffic flows on the Nibelungen Bridge and the new railway bridge provides a very useful method for analyzing the traffic mix. Through visual data capture, not only the number of road users can be determined, but also their types such as cars, bicycles, pedestrians and trucks can be accurately identified.
This enables a detailed breakdown of the sample segmentation, i.e. the share of different traffic routes in the total traffic volume. Due to the accuracy and versatility of the devices, valuable insights are gained that enable well-established planning and optimization of transportation infrastructure and sustainable mobility strategies.
A total of four systems have been installed at the bridge crossings of the Nibelungen Bridge and the new railway bridge. The collected data will then be made available through a common data exchange format to ensure further processing on the city dashboard.
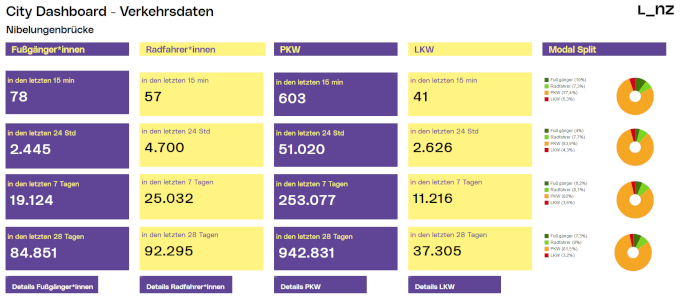 Example of traffic data from the Nibelungen Bridge, source: Stadtforschung
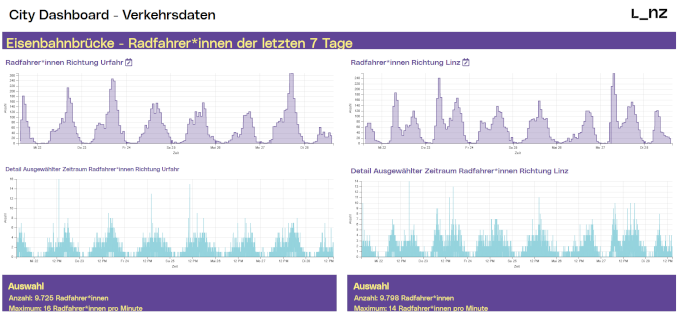 Example of cycling over the new railway bridge, Source: Urban Research
 Dashboard shows e-scooter rides in detail, Source: City Research
Interactive data access
Citi Dashboard offers many functions to users. This allows them to access city data interactively, although there are currently no download options for this data. Similar projects in German cities were analyzed and used as a source of ideas. However, the Linz project went further by including not only traffic information but also detailed data on other parts of the city’s life.
City Dashboard is currently not optimized for mobile devices, which is why its use is currently recommended for desktop users.
An important aspect of the project is data protection. In terms of data protection only harmless data is used in Citi Dashboard. Provision of data is also authorized by the responsible departments to ensure compliance with all relevant data protection regulations.
City Dashboard: city-dashboard.linz.at
Linz as the digital heart of the entire region – “Digital Linz” project
This project is part of the strategic plan “Digital Lens”. A team of experts from inside and outside the municipality works on behalf of Mayor Klaus Lüger and under the guidance of the Municipal Director. Mac.A Ulrike Huemer aims to maintain the city of Linz as a sustainable place to work and live. Current strengths are linked to future opportunities.
For more information https://digitales.linz.at
Information document for the press conference Mayor Klaus Luger, Mobility Officer Deputy Mayor Mac. Martin Hazard, MBA, Climate Councillor Mac.A Eva Schopsberger And Director of Magistrates Mac.A Ulrich Hummer In the title “City Dashboard”)
Also conversation partner:
Project leader Armin Haba, MSc, Urban Research